Known unknowns?
This time I start with another cyber cliché:
There are known knowns. There are things we know we know. We also know there are known unknowns. That is to say, we know there are some things we do not know. But there are also unknown unknowns, the ones we don’t know we don’t know.
Secretary of Defense Donald Rumsfeld, 2002
While some vendors claim they can spot the super badness “Unknowns Unknowns” using AI and Deep (really deep) Learning, I here present to you a simple way to spot “Known Unknowns” just to start your journey, hope you enjoy!
Despite being an atomic indicator, the mechanisms for inspecting the HTTP user agent are still a challenge in large scale environments. With the amount of data pouring into the SIEM from web proxies and internet facing web servers, detection engineers need to use creativity to win.
Not surprisingly, Splunk does provide commands such as rare and top, which allow users to organize results based on least or most frequent values. But is it as easy as counting the number of occurrences of an agent string and firing an alarm?
How rare ‘rare’ is?
Unless you want SOC analysts checking every single new agent string, which is not practical in most environments, math/stats can help you select better alert qualifiers with more context information.
What I am about to show is a simple unsupervised machine learning technique ✨ In case you haven’t figured, the title is an allusion to a nice talk from a Brazilian friend, Alex Pinto: Secure because of Math.
For allowing you to play and fine-tune the searches for your environment, I’m going to use Splunk’s Boss of the SOC (BOTS) v3 dataset in the following examples. In case you missed that, check it out!
However, since the dataset is not “accelerated”, I’m going to cheat and backfill the Web data model (DM) with all events in the dataset containing a non-null http_user_agent field. If you are not sure how to do that, check the docs or stop by Splunk’s Slack channels and say ‘Hi!’
How to find The rarest agent string from BOTS?
I tend to go with *stats commands as they provide more flexibility, but same can be achieved with rare and top as mentioned before. One simply needs to sort the results afterwards:
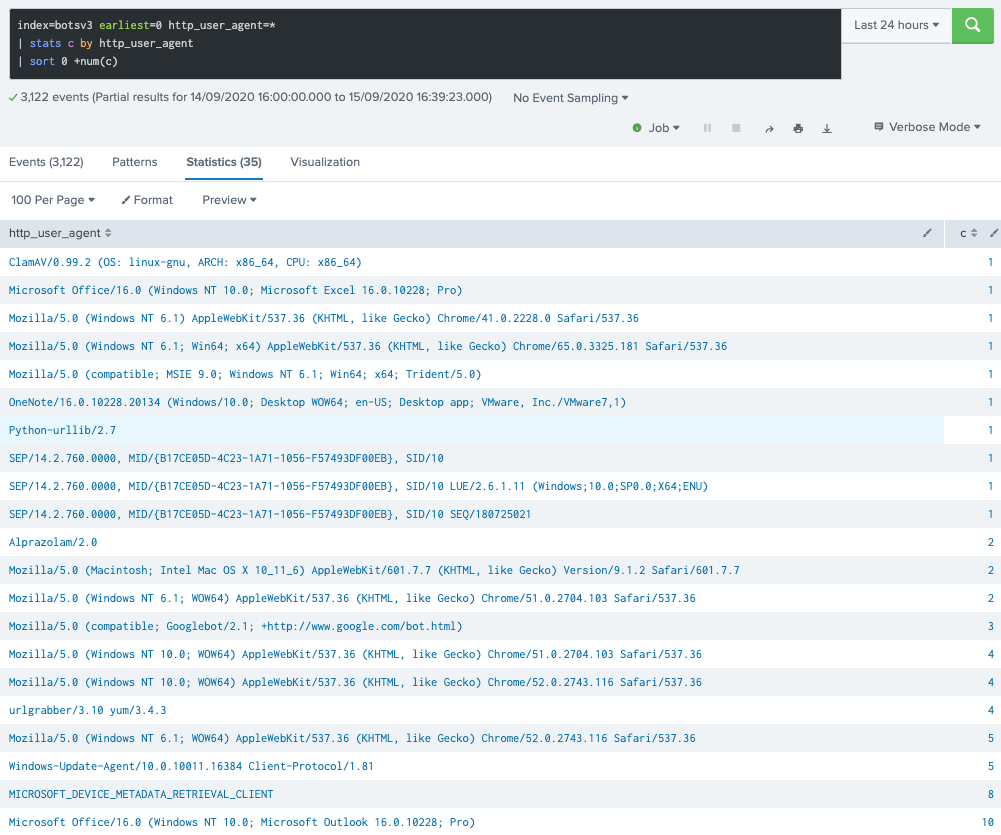
Of course, searching over raw events has a penalty since it may open multiple buckets (data directories) for retrieving data, but it already reveals some candidates for the most rare agent string observed in the dataset. Now, the same using the Proxy object from Web DM object:
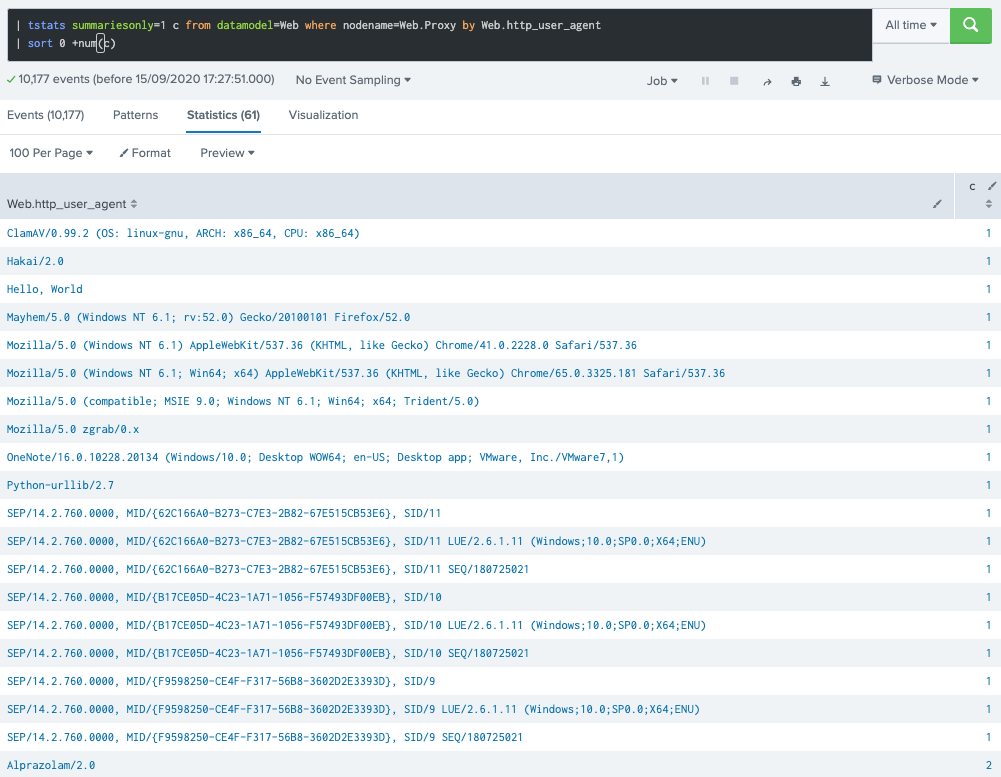
This time it took 0.3s and it reveals 61 distinct user agent strings. While that makes significant difference in my lab (raw search completes in almost a minute), in a large deployment, this makes a huge difference in use case design and search performance.
So why not alerting on every occurrence of a new, unique agent string? Simply because it would flood the SOC with many, many alerts depending on the environment, rendering the detection unusable in any enterprise environments given the amount of exceptions to be handled from harmless alerts.
The following would be a poor but valid embryonic detection prototype for spotting agents for the first time (in a day) within the last 30 days (daily run, earliest=-30d):
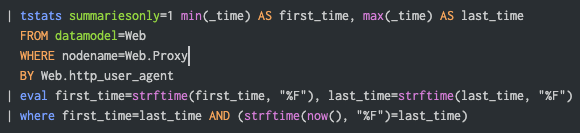
Besides the alert volume problem, in case you monitor MTTD (Mean time to detect) and other metrics related to earlier detection, simply setting that query to run hourly would ruin the system performance.
Splunk’s cluster command
This is another overlooked command. It basically groups events based on how similar they are. Of course, if you are looking for a more elaborated version, MLTK provides more options, but this one is available in most Splunk versions and does not require much effort as seen below:
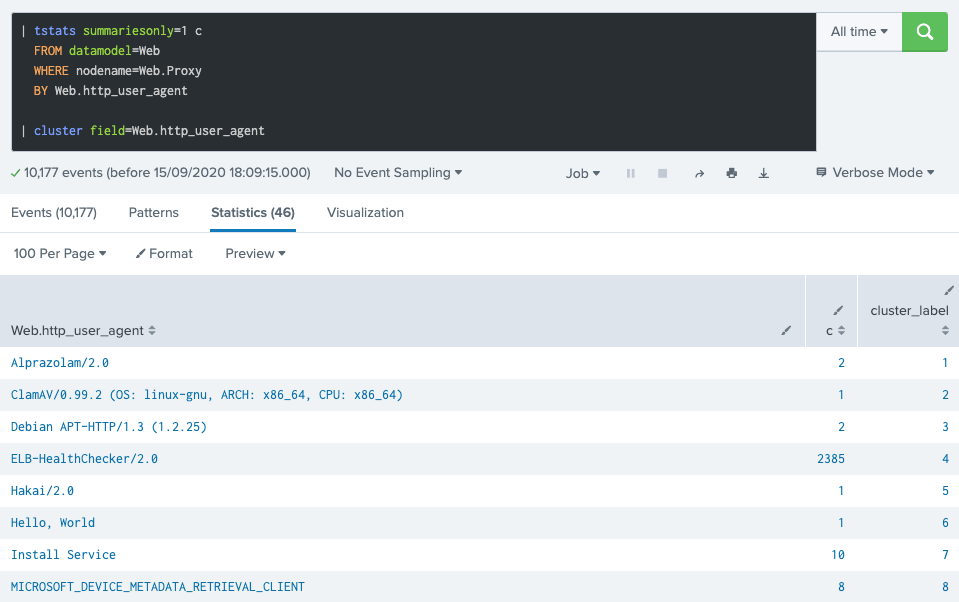
The cluster command adds a cluster_label field to each result row, indicating the cluster it is assigned to. It also takes _raw as a default target field, but in this case we pick DM’s Web.http_user_agent field.
How to control what goes in and out of a cluster?
That’s the t parameter (threshold) which controls the sensitivity. The closer it is to 1, the more similar events have to be for them to be considered in the same cluster. In short: lower value = less clusters.
Below is a more elaborated version of the previous command, now showing the cluster members and each cluster members count. Also, the default t value (0.8) is changed to 0.6:
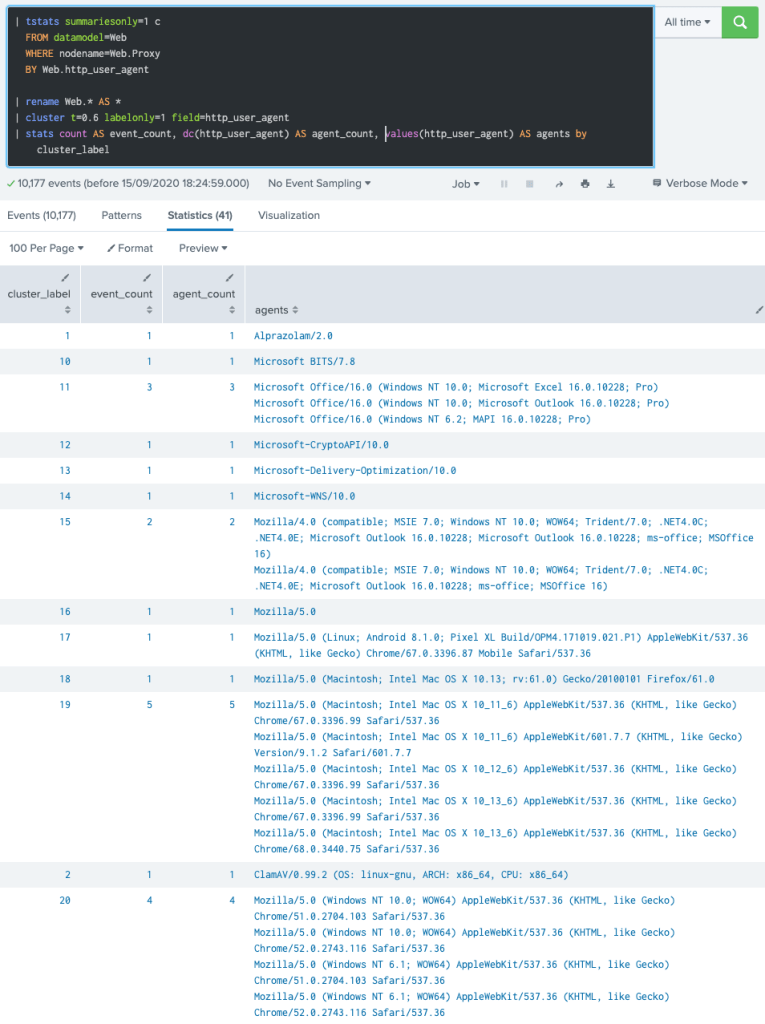
That’s pretty cool, isn’t it? 🤩
I’m sure some (detection engineers) readers are already wondering how many other potential use cases fit for this simple, yet powerful command.
Now what?
Think about the following pseudo-code (I like having that when delivering detection documentation):
1. Collect the stats on unique agents hourly (earliest=-1h);
2. Append the profile of unique user agent strings seen over the last 30 days;
3. Filter IN: agents from #1 which are NOT present in the agents profile;
4. Cluster the agents profile data + new, unique agents from #3;
5. Use the following enrichment points to determine an alert qualifier:
   5.1 Is the string matching any CTI's IOCs pattern? (easily done with lookups)
   5.2 Is the string related to a usual user/interactive agent (Mozilla)?
   5.3 Is the string related to a usual network/file transfer (*ftp*, *scp*)?
   5.4 (this list goes on and on, but I'm stopping here...)
6. Use the following cluster data points to determine an alert qualifier:
   6.1 How many members are in the same cluster the new string is part of?
   6.2 What's the most prevalent agent string in the cluster?
   6.3 How many distinct daily users or clients are using this cluster?
7. Determine a threshold (flag) based on alert qualifiers to fire an alert;
7. Trigger an alert aggregated by agent string when threshold is true.
The alert qualifiers (hopefully more engineers/researchers adopt such term!) not only serve as input for determining which scenarios are to be alerted, but can also make it easier to dynamically set an alert severity/priority/urgency, which is by far the very first indicator analysts look at.
Can you imagine how easier for an analyst to determine how rare or ‘interesting’ a new agent is from such an alert? That’s a complete different picture:
- One can easily determine if the agent is super-rare in case it’s the only member of a cluster;
- One can easily determine if a new agent is likely related to a browser upgrade or in case the attacker has misspelled a character in it when the cluster accommodates a widespread browser (ex.: Chrome);
- Another hypothetical example: assuming most Python based agents strings starts with capital P, an analyst can better asses if that needs further investigation (escalation) or not.
Agents profile search
Below is good start search for profiling the HTTP User Agent string, with that one running daily (early in the morning), it should deliver sufficient results while not hitting hard on performance:
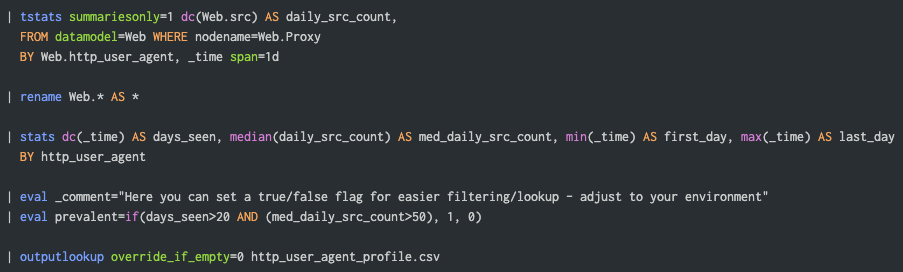
The following data points can be leveraged from that one:
- The number of days an agent was observed in the period (suggesting 30-45 days);
- Median daily number of clients (assuming src, but could be user field);
- First and last day seen and in case it’s prevalent on not.
Of course, additional stats can be added later, just evaluate if the value is worth the performance cost. For instance: most accessed domain, latest URLs, etc.
The actual detection search
To quickly recap, the idea is the following:
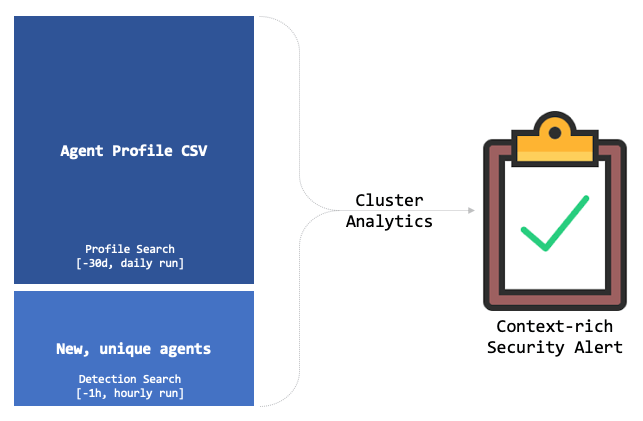
So the detection search will basically determine if an agent is unique, load the profile data (lookup) and perform the cluster analytics. The process will hopefully generate enough data points (alert qualifiers) to better determine if a scenario is worth to be alerted.
Here’s a prototype ready to be used in an accelerated DM enabled environment, which applies to most healthy Splunk Enterprise Security (ES) deployments. Please note that rudimentary support for exception handling is implemented here, in case you want to deploy that in production.
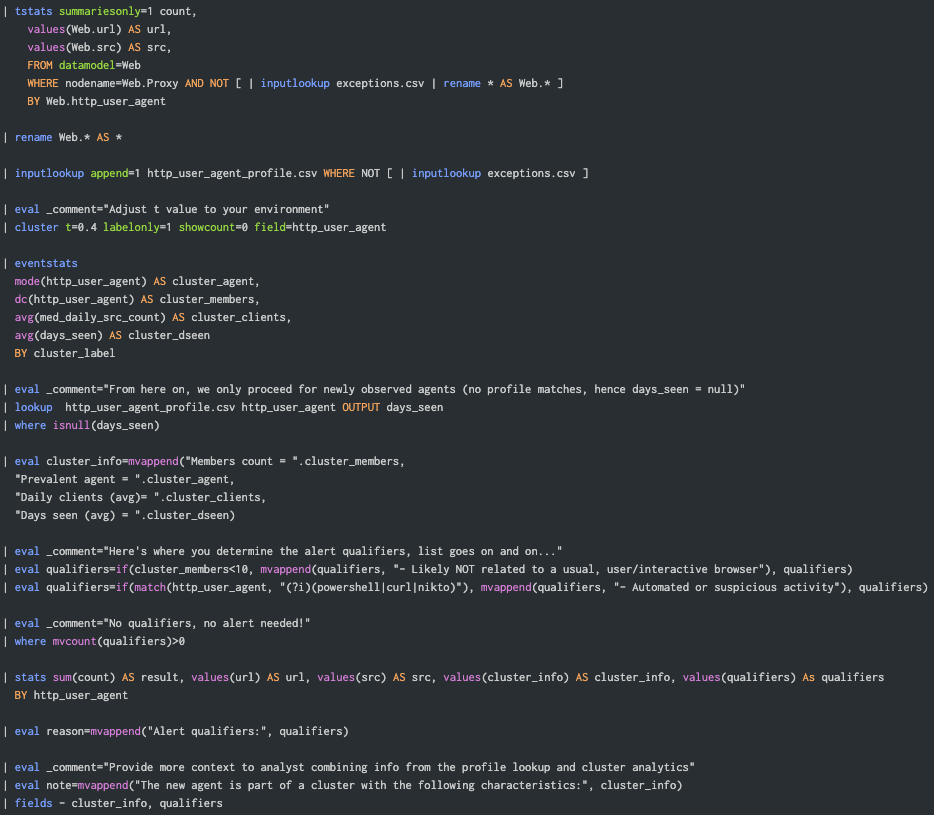
The lookup file exceptions.csv is storing the agents or any other combination (AND operator) of fields. For instance, if the lookup contains http_user_agent and url fields, results matching those values are filtered out from the analytics or detection output.
Some Alert output examples
To make sure we get “fresh” data, we cheat (again) by injecting some events at the index as follows:
| makeresults
| eval url="http://common.microsoft.com"
| eval http_user_agent="Microsoft Office/16.0 (Windows NT 10.0; Microsoft Outlook 17.0.10228; Pro)"
| eval src="host-2345"
| collect index=botsv3
Another one, this time a bit more suspicious:
| makeresults
| eval url="http://evilcorp.com"
| eval http_user_agent="Evil PowerShell v1.0"
| eval src="host-1234"
| collect index=botsv3
Since our detection defines as a threshold to alert on instances matching ANY alert qualifier, here’s a sample output matching the events we just added to the index (after they are picked up by the DMA):
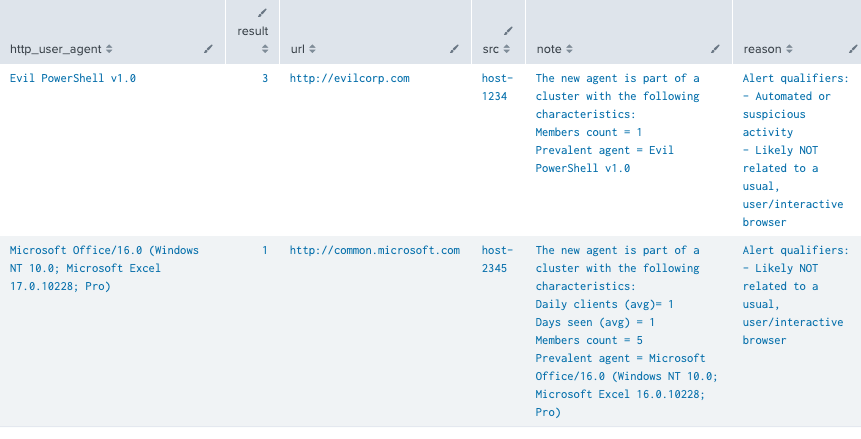
Note that the all those fields are rendered in Splunk ES Incident Review page and that the note field shows the extra context gathered after the cluster/profile analysis.
The second result exemplifies how a simple “Excel Upgrade” scenario may look like, which is a potential benign instance. Check the cluster attributes (most prevalent cluster member) and spot the difference when comparing to the actual agent string alerted on.
Now, if the threshold is set to alert on scenarios only matching more than one alert qualifier, we would of course only get the first result (Evil PowerShell) as seen from reason field contents. This threshold would basically translate to the following SPL:
| where mvcount(qualifiers)>1
Final thoughts

Again, those are all prototype (PoC) queries! Pretty much every customer will need a slight different approach, rendering sometimes significantly different searches, and here lies the beauty or challenge of content engineering.
A few things to consider before deploying to customers:
- First of all, evaluate the best options to profile agents from your environments. Should you consider all data sources feeding the Web DM? Should you consider 45 days instead of only 30?
- Make sure you define a good set of alert qualifiers, those are basically known as “features” in the ML/Stats domain. More alert qualifiers = more relevant alerts. For instance, besides the one already mentioned: Microsoft Office related agents NOT accessing common MS domains might be one.
- Instead of clustering on all agents, you may want to cluster only on a subset of them (suspicious, matching extra constraints/qualifiers). This is an option for massive deployments.
- In case you haven’t noticed, the cluster analytics section runs regardless of new agents observed or not, that’s because Splunk’s engine does not provide ways to halt or break command execution based on a condition like a procedural programming language does. However, there are some tricks to avoid that I am not including here for simplicity.
- A clear, easy to triage alert must include other fields in its output: drilldown to raw events, drilldown to triage dashboard, playbook/wiki url, exceptions lookup link, dynamic notable urgency based on alert qualifiers and much, much more (stay tuned).
Where are my SPL Nuggets?
Here are the main queries showcased here:
Profile Search
| tstats summariesonly=1 dc(Web.src) AS daily_src_count,
FROM datamodel=Web WHERE nodename=Web.Proxy
BY Web.http_user_agent, _time span=1d

| rename Web.* AS *

| stats dc(_time) AS days_seen, median(daily_src_count) AS med_daily_src_count, min(_time) AS first_day, max(_time) AS last_day
BY http_user_agent

| eval _comment="Quick flag for easier lookup - adjust to your environment"
| eval prevalent=if(days_seen>20 AND (med_daily_src_count>50), 1, 0)

| outputlookup override_if_empty=0 http_user_agent_profile.csv
Detection / Cluster Analytics Search
| tstats summariesonly=1 count,
values(Web.url) AS url,
values(Web.src) AS src,
FROM datamodel=Web
WHERE nodename=Web.Proxy AND NOT [ | inputlookup exceptions.csv | rename * AS Web.* ]
BY Web.http_user_agent

| rename Web.* AS *

| inputlookup append=1 http_user_agent_profile.csv WHERE NOT [ | inputlookup exceptions.csv ]

| eval _comment="Adjust t value to your environment"
| cluster t=0.4 labelonly=1 showcount=0 field=http_user_agent
| eventstats
mode(http_user_agent) AS cluster_agent,
dc(http_user_agent) AS cluster_members,
avg(med_daily_src_count) AS cluster_clients,
avg(days_seen) AS cluster_dseen
BY cluster_label

| eval _comment="From here on, we only proceed for newly observed agents (no profile matches, hence days_seen = null)"
| lookup http_user_agent_profile.csv http_user_agent OUTPUT days_seen
| where isnull(days_seen)

| eval cluster_info=mvappend("Members count = ".cluster_members,
"Prevalent agent = ".cluster_agent,
"Daily clients (avg)= ".cluster_clients,
"Days seen (avg) = ".cluster_dseen)
| eval _comment="Here's where you determine the alert qualifiers, list goes on and on…"
| eval qualifiers=if(cluster_members<10, mvappend(qualifiers, "- Likely NOT related to a usual, user/interactive browser"), qualifiers)
| eval qualifiers=if(match(http_user_agent, "(?i)(powershell|curl|nikto)"), mvappend(qualifiers, "- Automated or suspicious activity"), qualifiers)

| eval _comment="No qualifiers, no alert needed!"
| where mvcount(qualifiers)>0

| stats sum(count) AS result, values(url) AS url, values(src) AS src, values(cluster_info) AS cluster_info, values(qualifiers) As qualifiers
BY http_user_agent

| eval reason=mvappend("Alert qualifiers:", qualifiers)
| eval _comment="Provide more context to analyst combining info from the profile lookup and cluster analytics"
| eval note=mvappend("The new agent is part of a cluster with the following characteristics:", cluster_info)

| fields - cluster_info, qualifiers
