Alright, if you’ve arrived here to know my opinion about beautiful people, sorry for the title, this is not for you, I am of course referring to Splunk data models (DM).
As a Splunk content engineer, sometimes having to deal with and solve DM related issues before prototyping another detection, this is a topic that keeps coming back, so here’s my take on that.
Should I keep using Data models – or not?
Well, that’s still a very valid question. Just to start with and quickly address one of the elephants in the room: Splunk Enterprise Security (ES), also known as Splunk’s SIEM product heavily relies on DMs to function. Therefore, anyone else NOT using ES still have the option to use DMs or not.
But keep on reading, I will address this question further as I need more context around it. If you are looking for a “TL;DR” section, skip to “Myths Busted” below.
Data models: a 1 minute refresher
Without getting too “high-level” on the definition assuming you land here with some SPL knowledge, a DM is essentially an elaborated Splunk query. Let’s have a closer look at the following command:
| datamodel Authentication search
What happens under the hood is a regular Splunk search (index=x foo=bar), also known as “root search” but with an additional spicy: tags.
Think about Unix and Windows authentication logs. Despite coming from different systems, those logs should fit into the Authentication DM since a user must provide at least an account and a system (subjects) he/she is authenticating against.
How to tell Splunk those are essentially the same type of messages? You “tag” relevant events so that they are picked up by the DM’s root search. Note that tagging is done at event-level, not on a sourcetype basis, which implies one sourcetype might hold multiple tags, therefore perhaps feeding multiple DMs.
In the end, that search will basically look like the following one:
(index=win OR index=unix) tag=authentication
That’s clever, you can also define subsets of authentication related events by splitting them up into distinct DM objects. For instance, the Authentication DM has an object/node called “Failed_Authentication” where additional constraints are defined to pick failed logins attempts.
To know more about a data model definition, its root search and object/nodes, check the following:
| datamodel <DM_NAME>
Side note: to better walk the DM’s config and attributes, check datamodelsimple command.
To search events matching a specific DM object, for instance, the Failed_Authentication, use this:
| datamodel Authentication Failed_Authentication search
If you are curious enough to investigate deeper, check the Job Inspector “Search job properties” values, especially the eventSearch, normalizedSearch and optimizedSearch ones. Don’t be surprised with the lengthy queries! Depending on the configuration, it can take hundreds of lines.
Below is an example of an expanded search from the Malware_Attacks object of Malware DM:

Quick note: David Shpritz (@automine) pointed out one can also use datamodel’s command acceleration_search_string parameter to verify the exact query executed as follows:
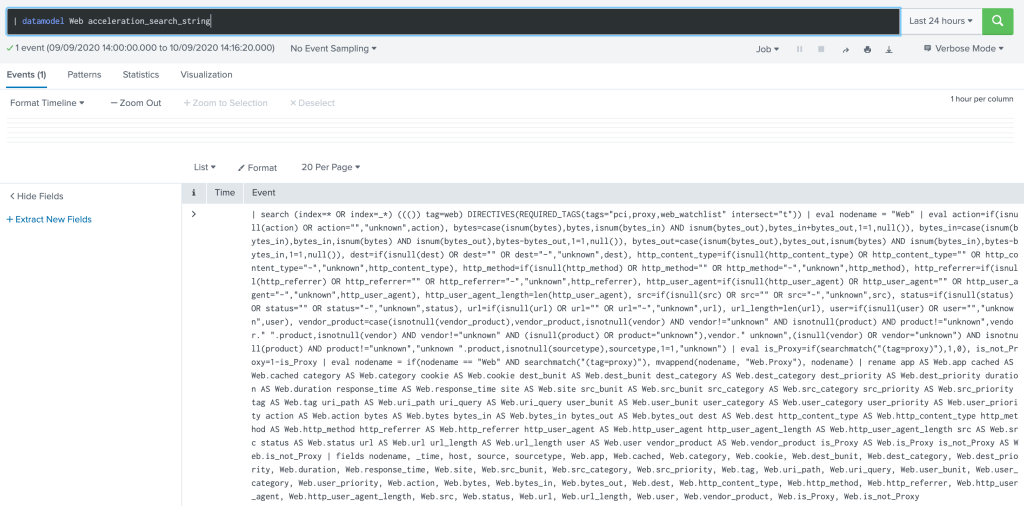
Note how the index constraint is dynamically built: (index=* OR index=_*). This implies that somehow all indexes will be touched, which impacts on performance to say the least. And that’s how many ES deployments will behave without further tuning.
Needless to say, this behavior along with how Splunk handles tag-based queries, is one if not the main reason why some customers struggle with ES, assuming it needs more HW and other wrong claims. As a side note: be sure to check “Watch your TAGs” section below to know more on that.
The best practice is to always define or limit the scope of which indexes should be considered for each DM. In this case, if user defines “mcafee” and “symantec” as the only indexes containing events relevant to fit into the Malware DM, the beginning of that expanded query would look like the following:
search ((index=mcafee OR index=symantec) tag=malware tag=attack (...)
And that would significantly reduce the performance hit on the system.
What about accelerated data models?
Well, simply put: take that root search, which encompasses all DM’s objects, run it every 5 minutes and dump the results into a data storage. That’s it. That’s how the accelerated data is created.
Splunk also refers to this storage area as “high-performance analytics store”. For long-time splunkers in the room: that’s the infamous tsidx file, which is actually part of any index bucket.
In practice, accessing data collected and defined within a DM is as fast as listing the number of events from all (non-internal) indexes and sourcetypes on a system (see below).
| tstats count where index=* by index, sourcetype
Similarly, we can count the number of events making into the accelerated Authentication DM with the following query:
| tstats count FROM datamodel=Authentication
Or a more elaborated one: failed attempts split by host generating the log and the target user:
| tstats count FROM datamodel=Authentication
  WHERE nodename=Authentication.Failed_Authentication
  BY host, Authentication.user
And with this quick refresher, that’s a good time to start addressing some myths around DMs!
Disclaimer: I am not a performance freak, nor a Splunk Architect. I simply write content, most time detections. I’m simply expressing my opinion from a user or developer perspective. Some stuff here may not be applicable to certain environments, corner cases, etc.
Myths Busted
1. “I can’t achieve normalization without using Data Models!”
One can still normalize the data by properly configuring a TA (short for Tech Add-on or an app mainly responsible for collecting/extracting log data).
Without getting into the normalization idealism topic, let’s pick the infamous FW example.
When you make sure every ACL/RULE action or outcome is stored at a field called action; and when it is related to a blocked connection its value is always blocked instead of “dropped” or “denied”, that’s normalization in practice.
Where’s that done? At the TA-level!
I don’t need a DM to make that happen. However, and that’s when people mix things up, by attempting to fit your FW events into the Network_Traffic DM, you MUST follow a normalization standard, which gives the impression the DM is actually doing the magic!
But that’s not all, after normalizing the events, you need to TAG them, otherwise the DM will not pick them up, as shown earlier. And that’s a hell of a job, ask any good TA maintainer!
In the end: Don’t put the cart before the horse. Normalization is a requirement for leveraging DMs and the former can be achieved without the latter.
2. “If I don’t use accelerated data models, I can’t have fast results!”
First off, not all DMs are accelerated by default. You need to set that up yourself as you risk bringing the entire index cluster down with a heavy “root search” query (one per DM) attempting to build/backfill the accelerated data store.
While some customers have good admins being able to maintain 1 year (!) worth of accelerated Network_Traffic DM data, some deployments will not even keep up with 1 week retention due to the lack of HW resources and/or best practices.
But back to the point: how to achieve faster results?
Well, there are many resources and features to explore here, but I would recommend you follow the slides/video from some Splunk conference presentations, starting with this nice one from David Veuve where he explores pretty much all methods, including one of my favorites: index-time field extraction.
Actually, many users think tstats command only works with DMs, not restricted to someone new to Splunk! That’s why it’s good to evaluate all the options before jumping into accelerated DMs which will overall demand more admin/maintenance power.
3. “I run Splunk Enterprise Security, so I must use accelerated DM!”
Despite having a good portion of its 60+ dashboards relying on DM based queries (accelerated or not), ES does not prevent you from leveraging “raw events” to write content.
This basically boils down to my main motto: Blame it on the use case design.
If the idea starts wrong, ANY method to achieve faster results will not suffice. Actually, the user will blame it on the method when it fails! “This is not looking good, you know, it’s because we’re not using accelerated data models!”
Example: “I want to track all new MAC addresses in my network within last year!” Answer: “The Network_Traffic DM has a dest_mac field. @Admin, please accelerate that DM for 1 year!”
Valid questions – multiple domains involved:
– How important is that use case to you? What’s the driver/audience behind this goal?
– Are you -really- going to consume that? Another report ending in the drawer?
– Which data sources provide such info? Are they reliable? Are they complete?
– Are you aware that a MAC can be forged by anyone with access to the network? How do you prevent “anyone” from entering the network? “Oh, we’d be better off tracking that first!!!” 🙃
This is basically the process of use case design, that’s not only when effort/cost can be estimated, but also when value will emerge (or not). If so, you set a strategy to get the data in and deliver in time – with what you have, no extra expectations.
Again, this can go from a simple summary that is built and accumulated over time via a saved search against raw events, from setting the “mac” field to be extracted at index-time making it available via tstats interface. Each customer/case requires a certain approach.
4. “Look at the Authentication DM, it should provide all you need!”
You can replace Authentication with any other DM. After may years freelancing, with pretty much all my projects involving ES, I can’t stress how much this statement is not true. I’m not picking on ES or Splunk but on the notion that users have around it.
It’s fair to say that customers have different appetite or demands in terms of quality. While most will be satisfied to have any detection (checkbox!), some will accept it only after extensive testing and validation, which includes checking whether a detection is covering all obvious gaps.
Example: “I want to track any brute-force against all our prod servers!”
Now look at how those logs are arriving at Splunk from some unix/linux based systems:
Nov 28 20:20:43 goblin sshd[519]: [ID 800047 auth.info] Failed none for NOUSER from 192.168.1.9 port 51025 ssh2
Nov 28 20:20:43 goblin sshd[519]: [ID 800047 auth.info] Failed publickey for NOUSER from 192.168.1.9 port 51025 ssh2
Nov 28 20:20:44 goblin sshd[519]: [ID 800047 auth.info] Failed password for NOUSER from 192.168.1.9 port 51025 ssh2
Nov 28 20:20:45 goblin last message repeated 2 times
Do you really think the last line – absolutely important – for writing such detection will end up in the Authentication DM? I have many other examples like that touching other DMs.
A few options here: go with DM and accept the detection is half-baked, re-design the DM given all its implications (rebuilds, maintenance, etc), or simply write a proper detection based on the raw events?
Again, no one to blame here. Splunk DMs have evolved a lot since the time I was a PS consultant and thinking from a Product Manager perspective, there are many other priorities to address in the product life-cycle. But things we should be aware of when writing detections.
Final Thoughts – User experience
If you’ve reached here, hopefully learning something out of my point of view, please feel free to provide feedback and opinions. In the end, I believe it all comes down to a Product Management challenge: how much of user experience can be compromised for getting a feature out quickly?
User Experience: using tstats instead of raw event search
First off, I haven’t found any other way (happy to learn!) but to use tstats with summariesonly=1|true to leverage accelerated DM events. That is, if your searches are not using that, you risk falling back to the same speed and performance hit as a regular raw search.
In other words: datamodel, from, pivot, tstats without summariesonly=1. They DO NOT leverage the accelerated data, something to keep in mind.
When you start a search like the following:
index=x sourcetype=y foo=*
You get all fields and use fields command to filter in/out the ones needed. With tstats, you have to either use values() or provide the field name you want (needs to be part of the DM) in the split/by clause:
| tstats summariesonly=1 count where index=x sourcetype=y by foo
In case you need _time, you basically need to turn the results into a time-series by appending the following to the query, and then later process the results as you would when starting from a raw event search query.
| tstats summariesonly=1 count where index=x sourcetype=y by foo, _time span=1d
For DMs, that means you need to validate if a DM is properly picking the data you need as an additional step before writing a detection. Even though this may be done during the data on-boarding process, chances are the team simply validated the event flow via regular raw event search.
Now, how many actually care about it? 🤫 As we start seeing more testing and automation (CI/CD, adversary sim, etc) being added to the use cases maintenance workflow, this tends to be minimized.
The DMs were basically introduced after the Enterprise Security App (ES) product was acquired by Splunk to enter SIEM space, not part of its Core/Enterprise product.
Despite the advantage of writing a query that is technology-agnostic, which makes it into a HUGE market advantage (or claim), conforming to a DM still requires some good amount of management to make sure the Data Inputs (TAs) comply and the acceleration kicks in as expected.
A TA upgrade in a big deployment is already challenging on itself, rest alone what comes after you realize the new events are not making into the DM anymore. Again, Splunk administration is a full-time job and if you want to step up in content engineering, there’s no time to do both (properly).
Watch your TAGs
For the curious splunkers, especially admins, it’s also worth noting that DMs essentially rely on tags, and the way Splunk’s search engine performs searches based on those can become really tricky, despite recent developments.
I suggest you watch this awesome presentation from conf’s 2015, especially in case you work on TAs and custom DM development. It was delivered by Martin Müller: Optimizing Splunk Knowledge Objects. Video and slides available.
Lastly, despite all the gotchas, again, with a well maintained deployment or in other words, with admins up to the challenge of maintaining accelerated DMs, fully aware of the issues mentioned here, there’s no point in not leveraging accelerated DMs for writing new content and detections.
