There’s so much we can do in regards to Quality Assurance (QA) in a detection engineering practice, where to start? I’m sharing one of the first queries I usually leverage for gauging quick correlation searches (rules) stats in a Splunk ES environment.
Alerts, Alerts everywhere!
Metrics is a very controversial topic (Moneyball, anyone?), mostly because [1] it’s challenging to agree on which ones to collect/monitor and [2] we have an obsession for the process outcome, the end result.
While [1] is straightforward, [2] sounds like spiritual advice: we focus on the final result (think case status) and overlook the path to get there (alert/case life cycle), but let’s hold this for another post.
In short, here are the infamous metrics/charts: alerts by status, alert volume timelines, alerts by priority and the list goes on… but what if the alert does not come to exist in the first place? I can *guarantee* it won’t even show up in most teams reports! 😵
Testing 1, 2, 3
If there is one initiative that brought detection engineering topic to a whole new level recently, this is MITRE ATT&CK. Regardless of defensive/offensive, it has enabled teams to talk the same language, not only between themselves but with upper management and also among vendors, analysts, etc.
Nevertheless, before tagging rules with the framework techniques and showing a coverage report, you need to make sure those rules actually do work. And here we enter testing. Just like in any software development life cycle, without that, one cannot deliver nor maintain code quality.
It comes with no surprise many teams are establishing detection engineering practices with testing as a mandatory stage in their detection or rule development workflows, either done manually or with the aid of adversary/attack simulation tools.
Are my rules firing alerts as expected?

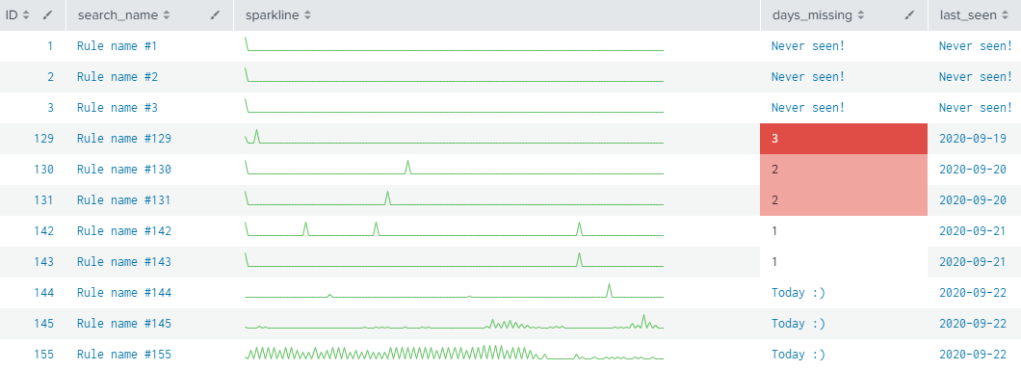
Without further motivation, let’s get down to it. With this simple query you will be able to determine the following metrics – for each active correlation search in your Splunk ES Search Head:
- a simple timeline (sparkline) depicting the alert frequency;
- when was the last time a notable event (alert) was seen from it;
- and how much time since the last observed alert (days missing).
Now, regardless of your current state on Testing or QA topics, the following shows a search and its output that should help you on this journey. Copy-able SPL is available further below.
Where’s my SPL Nugget?!
For most customers running a stable, healthy Splunk ES environment, even by setting the time frame to “All Time” should be fine. You can also send the query to background and check it later. However, I advise you evaluate and discuss applicability and tuning with your team before running it. ⚠️
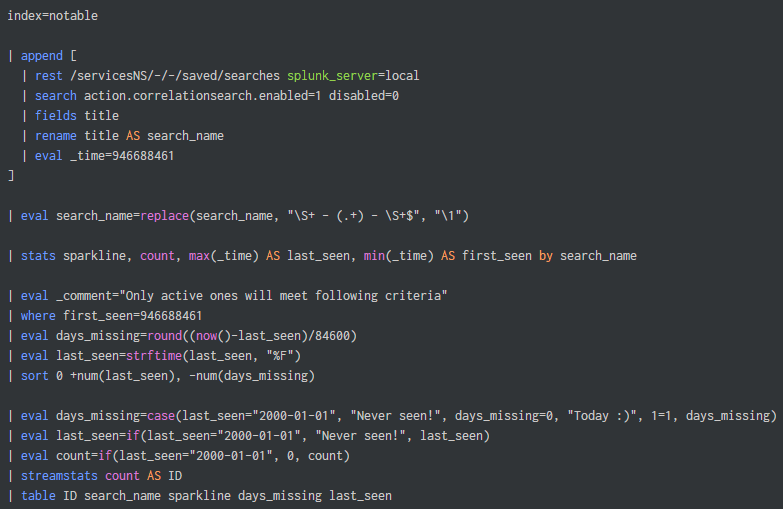
Lastly, I am using the plain index=notable here for simplicity and speed. You should evaluate using `notable` macro which will allow you not only to filter suppressed alerts, but also to gather even more interesting metrics per rule – depending on how ES features are leveraged (status, urgency, etc).
index=notable

| append [
  | rest /servicesNS/-/-/saved/searches splunk_server=local
  | search action.correlationsearch.enabled=1 disabled=0
  | fields title
  | rename title AS search_name
  | eval _time=946688461 ]

| eval search_name=replace(search_name, "\S+ - (.+) - \S+$", "\1")

| stats sparkline, count, max(_time) AS last_seen, min(_time) AS first_seen by search_name

| eval _comment="Only active ones will meet following criteria"
| where first_seen=946688461

| eval days_missing=round((now()-last_seen)/84600)
| eval last_seen=strftime(last_seen, "%F")
| sort 0 +num(last_seen), -num(days_missing)

| eval count=if(last_seen="2000-01-01", 0, count)
| eval days_missing=case(last_seen="2000-01-01", "Never seen!", days_missing=0, "Today :)", 1=1, days_missing)
| eval last_seen=if(last_seen="2000-01-01", "Never seen!", last_seen)

| streamstats count AS ID

| table ID search_name sparkline days_missing last_seen