This one comes from a recent tweet:

The code is available below and is pretty straightforward (based on _internal). Let me know if there’s any issue when deploying/testing in your environment.
I haven’t seen any ES dashboard providing such metrics yet, perhaps something to suggest the Product team? Some community-driven ideas are collected here (requires login).
index=_internal sourcetype=scheduler savedsearch_name="* - Rule" scheduled_time=*

| fields suppressed skipped run_time savedsearch_name
| rename run_time AS duration

| fillnull value=0 suppressed skipped
| bin _time span=1d

| stats count AS executions, sum(*) AS sum_*, median(*) AS med_* by savedsearch_name, _time
| stats max(executions) AS executions, median(sum_*) AS sum_*, median(med_*) AS med_* by savedsearch_name

| eval savedsearch_name=replace(savedsearch_name, "\S+ - (.+) - \S+$", "\1")
| eval med_duration=round(med_duration/60)
| eval sum_duration=round((sum_duration/60)/60)

| table savedsearch_name executions *_duration med_skipped med_suppressed

| rename savedsearch_name AS "Rule Name"
| sort 0 -num(sum_duration), -num(med_duration)
Note: evaluate if it’s worth replacing median() with max() for metrics such as suppressed and skipped searches. To uncover the suppression name, use `notable` macro in a drilldown by click.
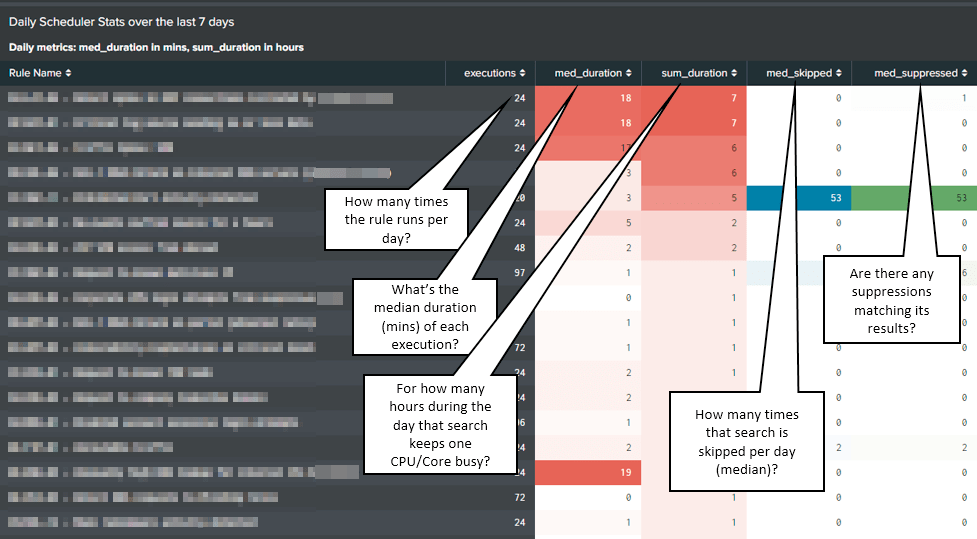
For applying the heatmap overlay per column, simply define it once the panel is loaded in a SimpleXML dashboard, details instructions are here. The end result looks similar to the following: