I’ve had the chance to work with many great security teams during my career and in 2012, I had the opportunity to join Verizon’s SOC in Germany. That was a very challenging experience considering its massive scale SecOps.
It was also by that time when I realized Splunk could be used as a sort of BI/Reporting platform given its ability to quickly generate eye-catching reports or dashboards from case or incident management systems data.
Today, when designing and building detection mechanisms, it’s easier to notice the link between threat detection engineering practice and overall SOC services quality, regardless of target customer (internal/external).
The security alert dichotomy: TP x FP

Without going too deep on that, I guess the true-positive (TP) versus false-positive (FP) classification became widespread in Infosec after the introduction of pattern based Network Intrusion Detection Systems (NIDS). In a nutshell, here’s how the assessment is done:
“Does the input (network flow) match a pattern?” If yes, it must be either a TP, when indeed the attack or threat is verified; or a FP, when despite the positive test, the attack or threat expected is not present.
On the other hand, if the answer is no, then someone may later find it to be a false-negative case, when the threat or attack is present but the detection did not trigger an alert. A true-negative case is when “everyone is fine“.
It turns out modern detection systems and strategies require more fine-grained TP/FP labels (specification) for tracking important metrics.
In a threat detection context, higher granularity outcomes will make it easier to determine, for instance, how good or bad a rule is performing. Ultimately, better supporting decisions to modify or even shutdown a detection mechanism. More on this later on “metrics” section.
Driving QA from alert states
Since part of my work involves developing and testing premium detection content for customers, it makes perfect sense to define a methodology to track security alerts quality over time.
Security Alert Handling Workflow
The following diagram is meant to help those teams willing to leverage Quality Assurance (QA) as part of their development/engineering process.
As expected, the process varies widely so you may need to modify it based on your requirements or limitations. It’s by no means a standard for handling security alerts but something to inspire other teams to better track metrics.
For simplification, assume a security alert life-cycle. No need to enter the event, alert, case, incident, investigation debate at this point. This enforces a consistent alert handling process while enabling reliable metrics extraction.
The idea is that by tracking alert state transitions, especially the final ones, a team is able to link a detection to its output — where the value lies in the end.
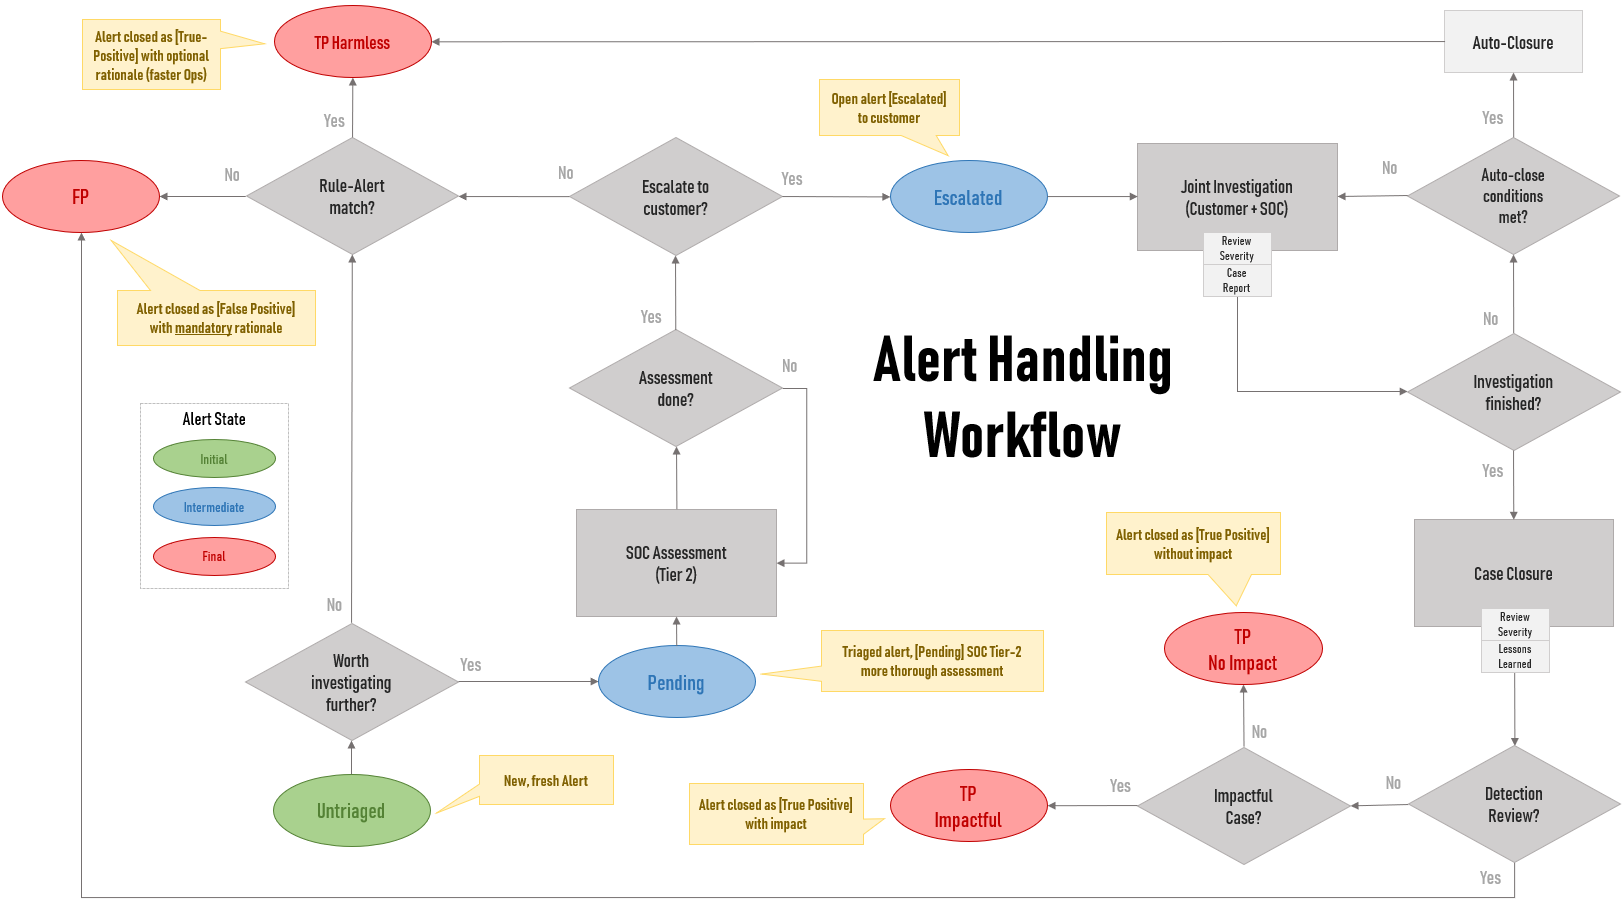
The “Rule-Alert match?” question is perhaps the main point here. It means “Is the detection logic behaving accordingly? Is it performing as expected?”. Or simply put: is there a bug in the detection code?
This reinforces a clear distinction between a plain FP and a TP, enabling the team to consistently handle alerts and extract insights from metrics.
An optional status can be added for auto-closed alerts: TP-Intederminate. But decided to keep it out for simplification here (as it applies to others).
The (TP) Harmless state
Even if you have a really good detection engineering team, the detection may fulfill its goal (positive test) while not spotting an intrusion. Depending on your interpretation, this may not clearly fit into a FP or a TP as most know it.
Sounds confusing? Unfortunately, that’s the way many teams are still handling security alerts today — which is reflected on unreliable metrics.
Let me try to clarify why such distinction is important:
- Is a FP a false alarm due to the lack of a real intrusion or is it because the detection does not fulfill its goal (spot a scenario)? Remember: detecting suspicious behaviors or anomalies is not always linked to an intrusion.
- Is the goal to solely alert on intrusions? If so, any alert not linked to an intrusion falls into the FP bucket. If that’s the case, do yourself a favor and specify a sub FP classification to track positive rule hits.
For instance, you are detecting high-rate authentication activity from the same source (host) but it turns out an alert fired due to a newly deployed (authorized) vulnerability scanner solution or yet another IAM platform test.
The important thing to notice from above example is that the rule or detection performed as expected, despite no real threat. So however you classify it in the end (TP/FP), you should track this success.
That’s equivalent to a TP with no impact but without requiring the alert to go through the entire escalation process (customer interaction) or when SOC knows upfront the scenario is innocuous despite the successful detection.
Therefore, it’s good to have an optimal, well defined path for handling this harmless yet very relevant metric. This tends to drop as you fine-tune the detection but chances are it will continue as the most frequent outcome.
As you may have guessed by now, a FP is when the detection fails m̵i̵s̵e̵r̵a̵b̵l̵y̵.
Not because it did not spot an intrusion but, in my view, it’s even worse: that’s because there’s an issue (bug) in the detection mechanism (code) since it does not behave as expected (spotting a suspicious scenario).
The workflow addresses such outcome (FP) with the following scenarios:
- Not “worth investigating” alerts, at Triage stage (no customer interaction)
- Escalated alerts, after customer interaction (Detection Review)
This process needs to be carefully reviewed and understood by operations (threat analysts, hunters, engineers) as well as leadership teams since it will reflect on reports and any other process relying on metrics gathering.
I’ve been to many customers, every single one has small deviations or adjustments that apply (more on that on “Expand it further” below).
Which metrics to track?
Relevant, actionable, quantitative (preferably) and consistent.

Here I list just a few (sometimes in a question format), which will enable the team to better support decisions or draw insights, correlations (careful here) and potential conclusions around operations and engineering work.
Of course, some of those are easier to interpret with dataviz (charts).
Operational Metrics
- Median time (days) to auto-close an escalated case (customer engagement, alert fatigue)
- Median time to triage an alert (training, alert complexity)
- Median time before escalation (staffing, automation demand)
Engineering Metrics
- Which detection provides the best TP/total alerts ratio? Can you spot any deviations when breaking it down by TP sub classifications?
- Which alerts have the highestFP/total alerts ratio?
Consider “per capita”. Ex: how many TPs for every 100 alerts (or 10)? - What’s the median time to close or assign a final status to an alert broke down by detection?
- What’s the median time to detect (log time compared to alert triggering time) for TP alerts?
- What’s the time (days) since last alert per detection? This comes in handy especially if you leverage “red events” generators like this.
Expand it further
Other scenarios that may deserve their own, distinct states or a better specification may include:
- Alerts linked to red team exercises (flags) or “red events” (benign, automated events generated to systematically evaluate detection)
- Alerts linked to authorized (external/3rd party) pentests
- Alerts linked to internal “vulnerability scanners” and other sec appliances
- Suppressed alerts (over filtering risk)
For MSSPs, some of those metrics may perfectly fit customer reports as well or even deserve their very own SLA defined.
Also, explore different dataviz and find the one that best suits each metric to be displayed given the audience, media, etc. Splunk provides many here!
Which other metrics have you found important? What’s your take on that (Threat Detection QA)? Please comment and share your ideas! Also feel free to reach out (DMs open).
Originally posted at Medium on Jun 12, 2019.
