 After some days playing around with a few interesting apps, I’ve decided to give it a try, and learn how to integrate RAW data visualization project into Splunk.
It turns out, by reading the (latest) right App Development documentation (thanks IRC!) and checking good examples, it’s quite an easy job, especially if you are already familiar with web development technologies (HTML, JS/jQuery and the likes).
Here’s a bit of motivation to do it:
- Connecting with the Splunk community;
- Getting up to speed with the Splunk Web Framework for quickly developing custom content (views, dashboards, apps, etc);
- Easily visualizing search results in different formats by leveraging the search bar functionality, rather than editing hard-coded dashboard searches;
- Helping to spread the word about the power of data visualization by demonstrating the incredible D3 library and the RAW project;
- Having fun! (a must for any learning experience nowadays, right?)
RAW project?
I will not dare describing it better than the creators of this great project:
“The missing link between spreadsheets and vector graphics.”
A more detailed description is also found from the project’s README file:
RAW is an open web tool developed at the DensityDesign Research Lab (Politecnico di Milano) to create custom vector-based visualizations on top of the amazing d3.js library by Mike Bostock. Primarily conceived as a tool for designers and vis geeks, RAW aims at providing a missing link between spreadsheet applications (e.g. Microsoft Excel, Apple Numbers, Google Docs, OpenRefine, …) and vector graphics editors (e.g. Adobe Illustrator, Inkscape, …).
What you can do instead is simply browsing the project interface here: app.raw.densitydesign.org. Paste your data or just pick one data sample to realize how easy it is to create a chart without a single line of code.
And since we are talking about one line of code, let’s get straight to the point. Here’s a dirty quick hack for automatically copying the search results into RAW’s worklfow:
$scope.text = localStorage.getItem('searchresults')
In fact, I’m not sure if that’s the optimal way to accomplish it, but that’s the only change needed within RAW’s code (controllers.js). The wonderful Italian mafia team at Density Design might be reading this now, so guys please advise! (I know you are very busy).
Nevertheless, after a quick read through AngularJS, that change looks like a quick win. What it does is tell the browser to load the data from a local storage into RAW’s textarea. Local storage? Remember Cookies and HotDog editor? That’s history! Actually, not.
The Splunk Code
By using the Web Framework Toolkit, creating an app is really easy. Just use the splunkdj createapp <app-name> command and start customizing the default view that is built in, home.html. Here’s the main code piece used for this app (JavaScript block):
{% block js %}
<script>

function createIframe(){
    // reset div contents
    document.getElementById("raw-charts").innerHTML = "";

    // create an iframe
    var rawframe = document.createElement("iframe");
    rawframe.id = "rawframe";
    rawframe.src = "{{STATIC_URL}}{{app_name}}/raw/index.html";
    rawframe.scrolling = "no";
    rawframe.style.border = "none";
    rawframe.width = "100%";
    rawframe.height = "3700px";

    // insert iframe
    document.getElementById("raw-charts").appendChild(rawframe);

};

var deps = [
	"splunkjs/ready!",
	"splunkjs/mvc/searchmanager"
];

require(deps, function(mvc) {

	// this guy handles the search/results
	var SearchManager = require("splunkjs/mvc/searchmanager");

	// initial search definition
	var mainSearch = new SearchManager({
		id: "search1",
		//search: "startminutesago=1 index=_internal | stats c by group | head 2",
		search: "",
		max_count: 999999,
		preview: false,
		cache: false
	});

	// count: 0 needed for avoiding the 100 limit (Thanks IRC #splunk!)
	var myResults = mainSearch.data("results", {count: 0});

	// tested with "on search:done" but unexpected results happened
	myResults.on("data", function() {

		// field names separated by comma
		var searchresults = myResults.data().fields.join();

		// debug code
		//console.log(myResults.collection());

		// loop through the result set
		for (var i=0; i < myResults.data().rows.length; i++) {
			searchresults = searchresults + '\n' + myResults.data().rows[i];
		}

		// better than cookie!
		localStorage.setItem('searchresults',searchresults);

		// search loaded, triggering iframe creation
		createIframe();

	});

	// keep search bar and manager in sync
	var searchbar1 = mvc.Components.getInstance('searchbar1');
	var search1 = mvc.Components.getInstance('search1');

	searchbar1.on('change', function(){
		search1.settings.unset('search');
		search1.settings.set('search', searchbar1.val());
	});
});

</script>

{% endblock js %}
The initial page for the app loads an empty search bar with a table view component right below it. After running a search, the table displays the search results and also triggers the RAW workflow, by loading the textarea with the table’s content.
Meet the workflow
In a nutshell, the visualization workflow works like Splunk’s default. The user runs a search command, formats the results and finally clicks on “Visualization” tab. Likewise, using this app the user is also able to customize chart options and export the results in different formats.
First Example
Here’s the first example in action, reachable via Chart Examples menu. The data comes from Transport of London data portal, this specific data set (CSV) is a sample for the Rolling Origin & Destination Survey (RODS) available under “Network Statistics” section from the portal.
Before handling the CSV file, the following command is needed for cleaning up the file header, basically replacing slashes and spaces by a “_” char:
sed -i '1,1s/[[:blank:]]*\/[[:blank:]]*\|\([[:alnum:]]\)[[:blank:]]\+\([[:alnum:]]\)/\1_\2/g;' rods-access-mode-2010-sample.csv
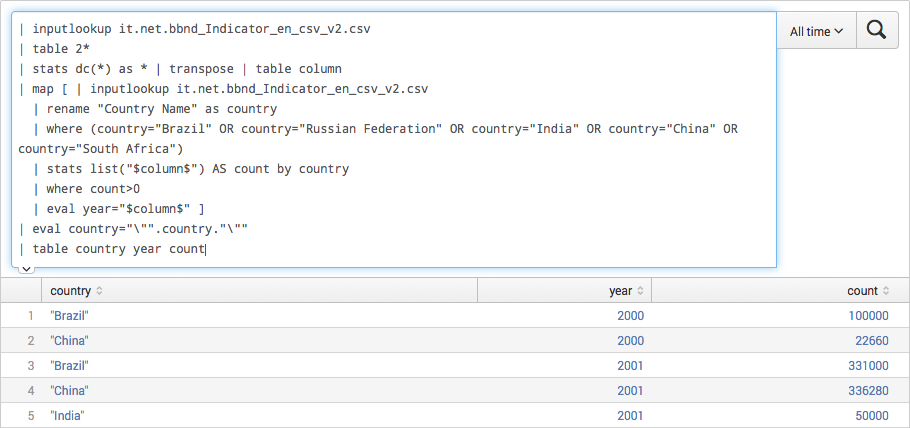
After clicking at the link example, the search bar gets preloaded with a specific search command, which triggers the table reload:
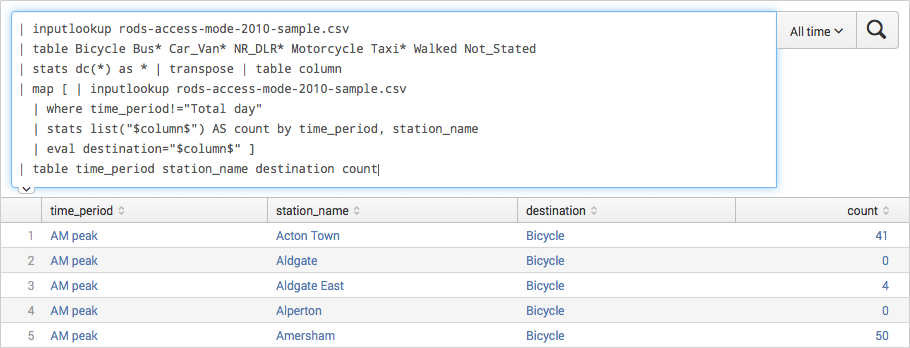 The results are synced to RAW’s input component, which is fully editable just in case:
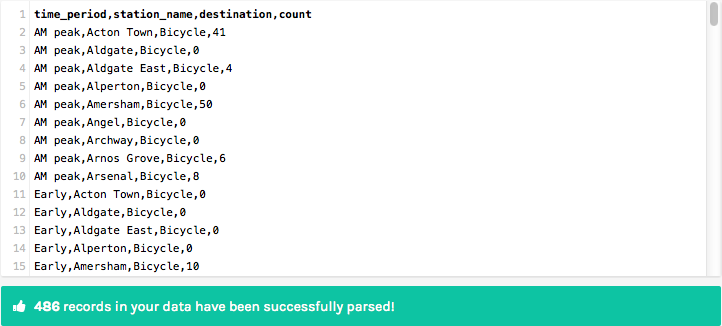
The user is then able to choose one chart type (multiples available). Here, the Alluvial/Sankey diagram is chosen:
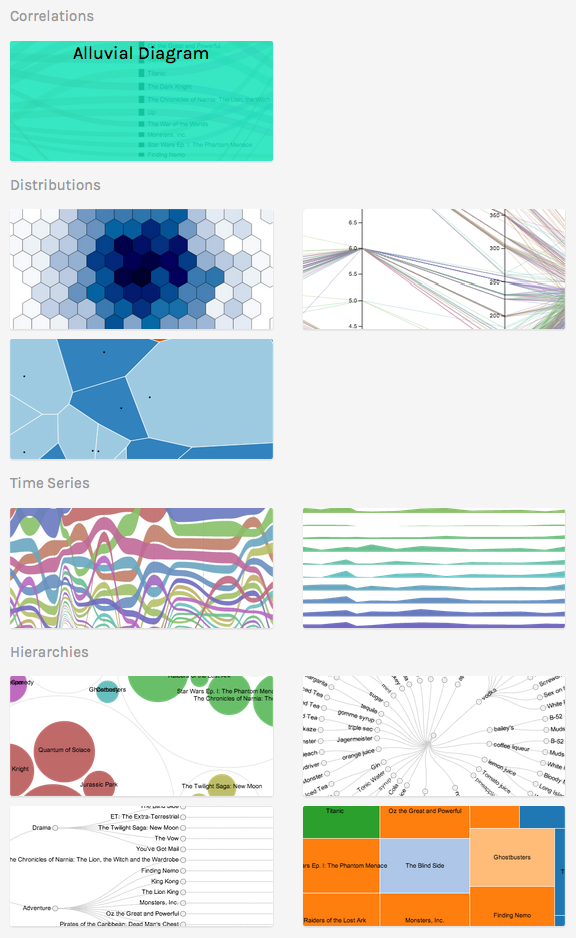
There’s also an option for adding your own chart in case you are willing to integrate your D3 code implementation with the project.
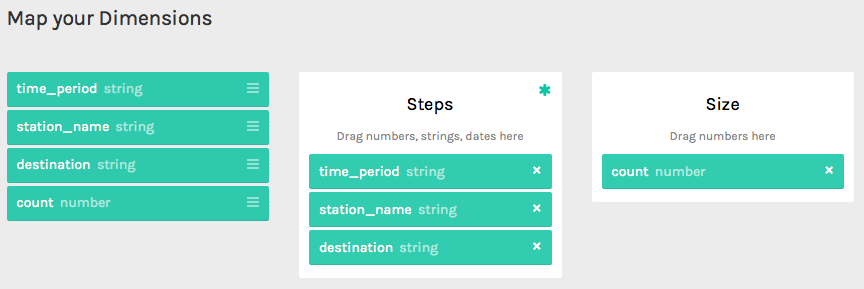
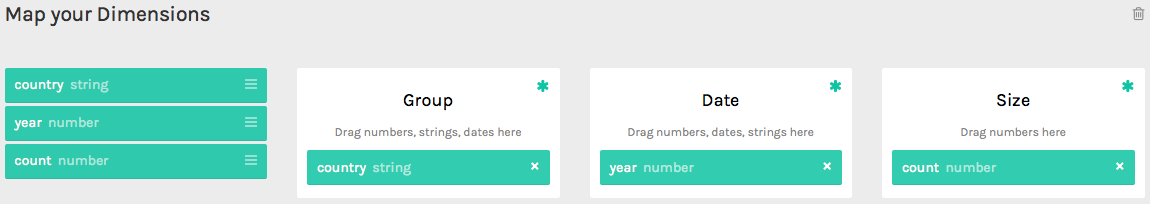
The next step is to select which fields (columns) will be part of the diagram/chart, and also how they will relate to the chart’s components (dimensions, steps, hierarchy, etc). For doing so, a nice drag and drop interface eases the job.
Just follow the instructions included within the example (step-by-step) . The final map setup should look like the following:
Finally, here’s the chart generated in the end:
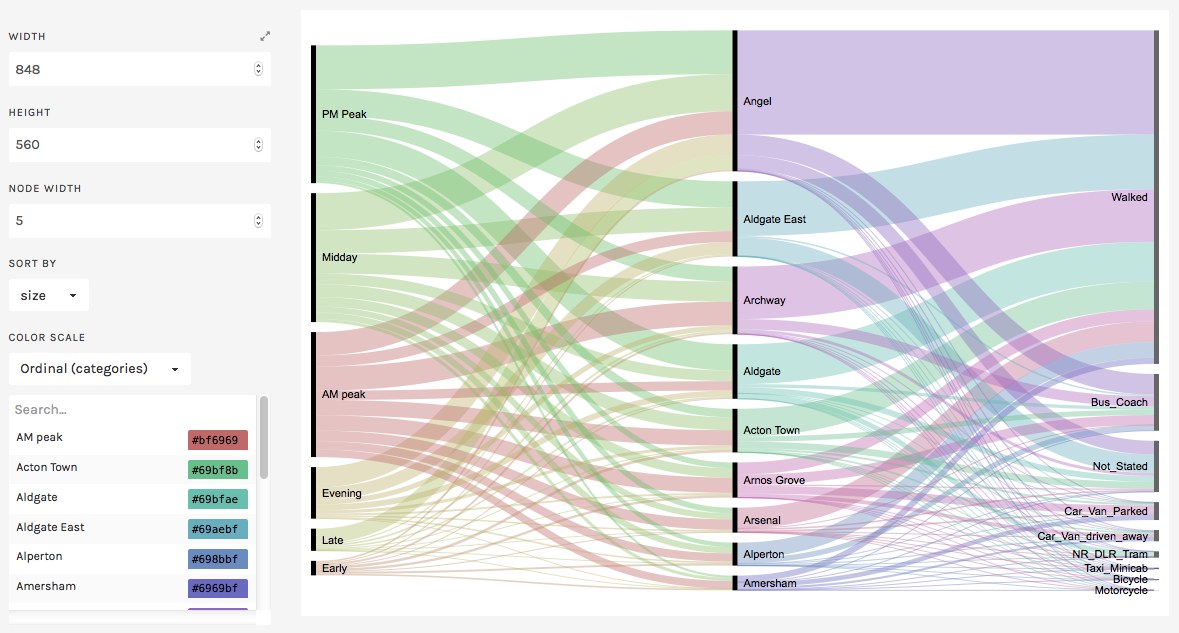
As you can see from this simple example, the chart better conveys the idea of flow & proportionality among the dimensions as compared to other usual charting options out there.
Optionally, the user is able to customize colors, sorting and other stuff, which may differ depending on the chart chosen. Exporting options are also available (SVG/HTML, PNG, etc).
Second Example
The second example leverages data from the World Bank data portal related to Internet subscribers. For this case, I’ve decided to apply a few constraints so that it becomes a bit simpler to render the results:
- Only a few countries are filtered in;
- Time period considered is 2000-2009.
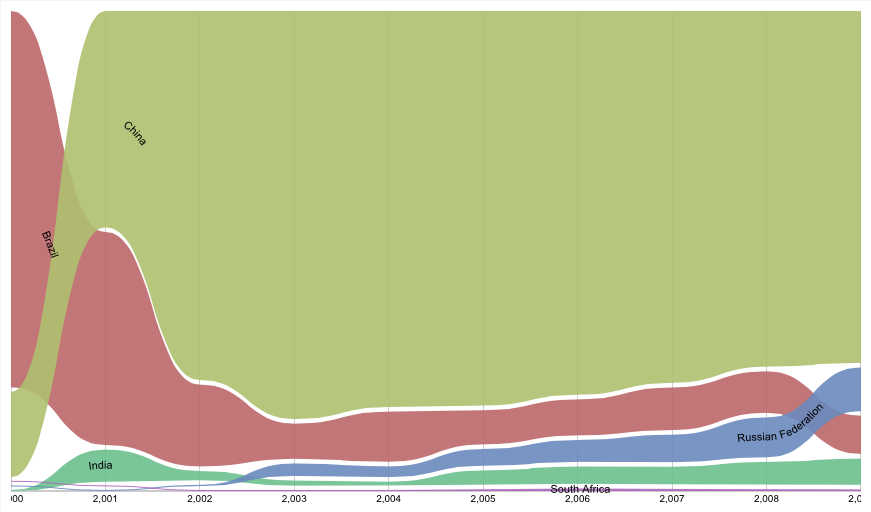
By following roughly the same steps described from example previously shown, the search gets preloaded with a search command and the user is instructed to follow a few steps to generate the graph. In this case, a Bump Chart, similarly to the one featured at NYT.
I hope the screenshots speak for themselves (click for full size). Detailed instructions are available from the app’s documentation and examples.
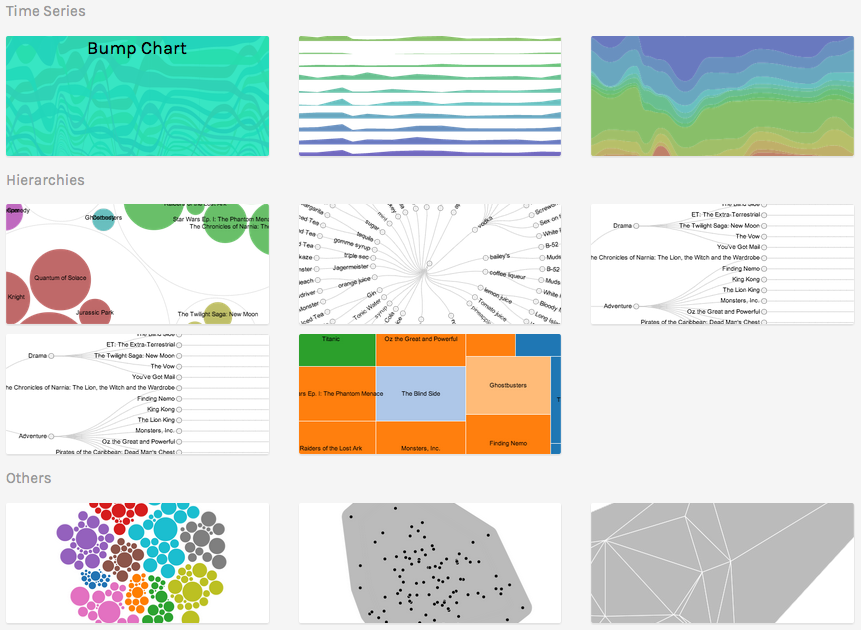
Here’s a list of currently supported charts/diagrams: Sankey / Alluvial, Bump Chart, Circle Packing, Circular / Cluster Dendogram, Clustered Force Layout, Convex Hull, Delaunay Triangulation, Hexagonal Binning, Parallel Coordinates, Reingold-Tilford Tree, Streamgraph, Treemap, Voronoi Tessellation.
Comments and suggestions are more than welcome! The app is available at Splunk’s app portal, and I will later upload the code to a common place (Github?) so it makes easier for everyone to have access and modify it.
- File name: rawcharts.spl (~19MB)
- MD5 sum: 24c507fab9efae8e919da13eaea96d34
- Download: https://apps.splunk.com/app/2640/

One Comment Add yours